We can apply statistical analysis to help you understand the impact of various factors, even external ones, on your business. Here is an example.
Challenge
Imagine you run a small coffee shop, and are looking at daily sales figures for July 2022 through October 2023. The sales figures are shown in the following plot. The challenge is to understand the impact of different factors on your sales.
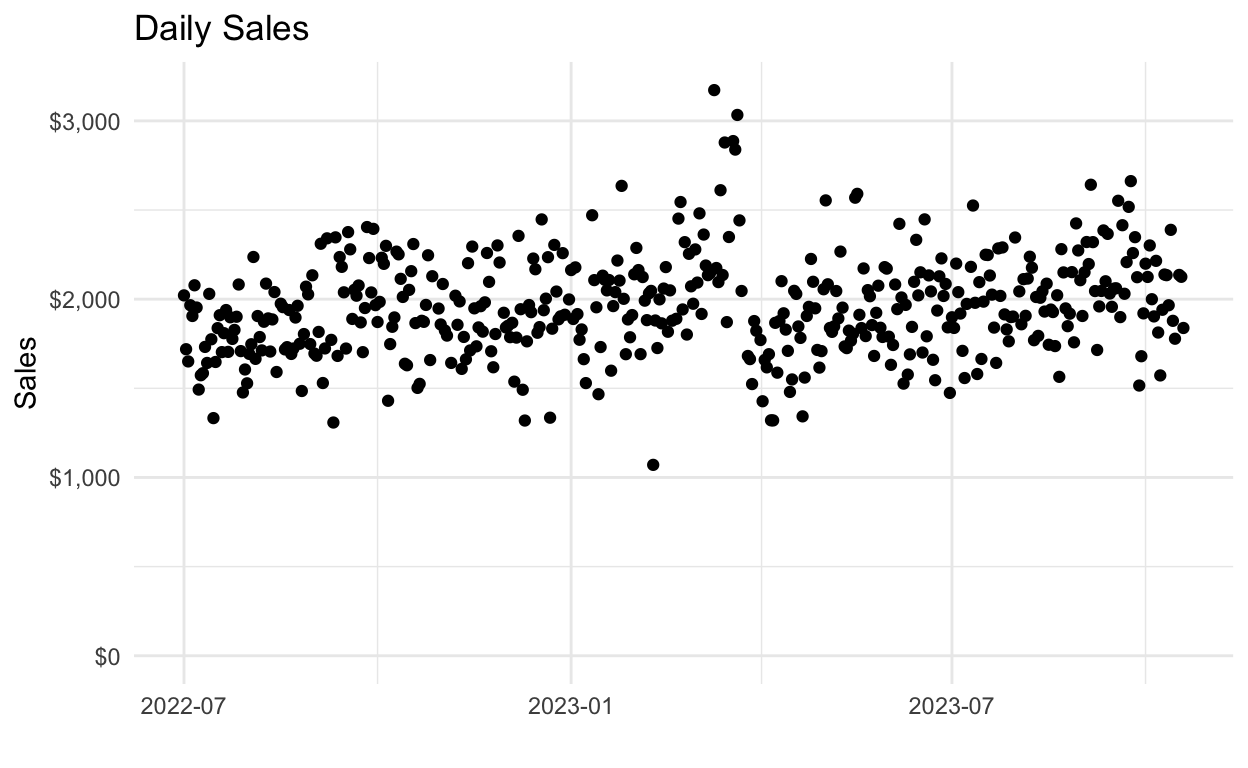
Overall we see a slight trend upwards, but there are some spikes around March 2023. Lets zoom in to see more detail:
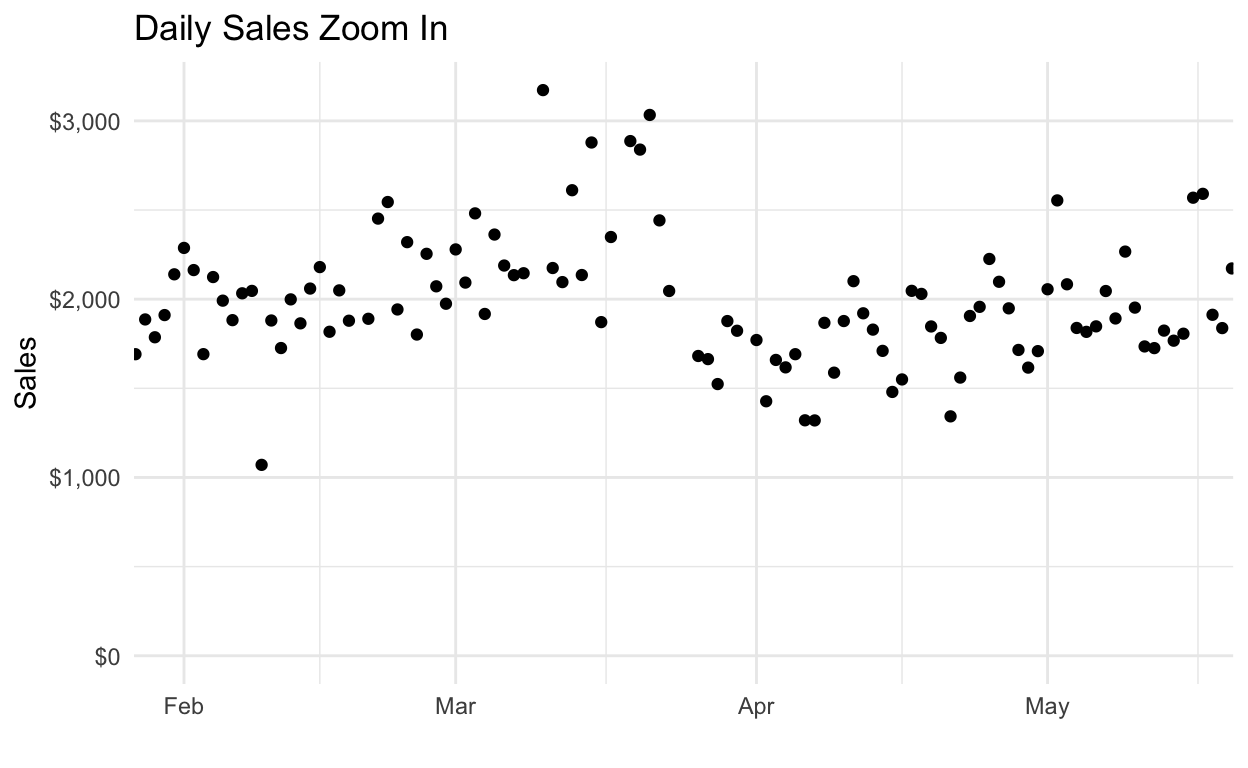
There is one low value in the first half of February, and then an increase in mid-March, then a sharp decline in early April, and then a continuation of the previous trend in later April.
So what happened?
Approach
We looked at the sales figures by day, as well as what was going on in the coffee shop’s immediate environment.
A neighboring coffee shop, a competitor, shut down for renovations on February 14, and reopened March 24. Lets indicate those dates on the overall plot so we can see what changed.
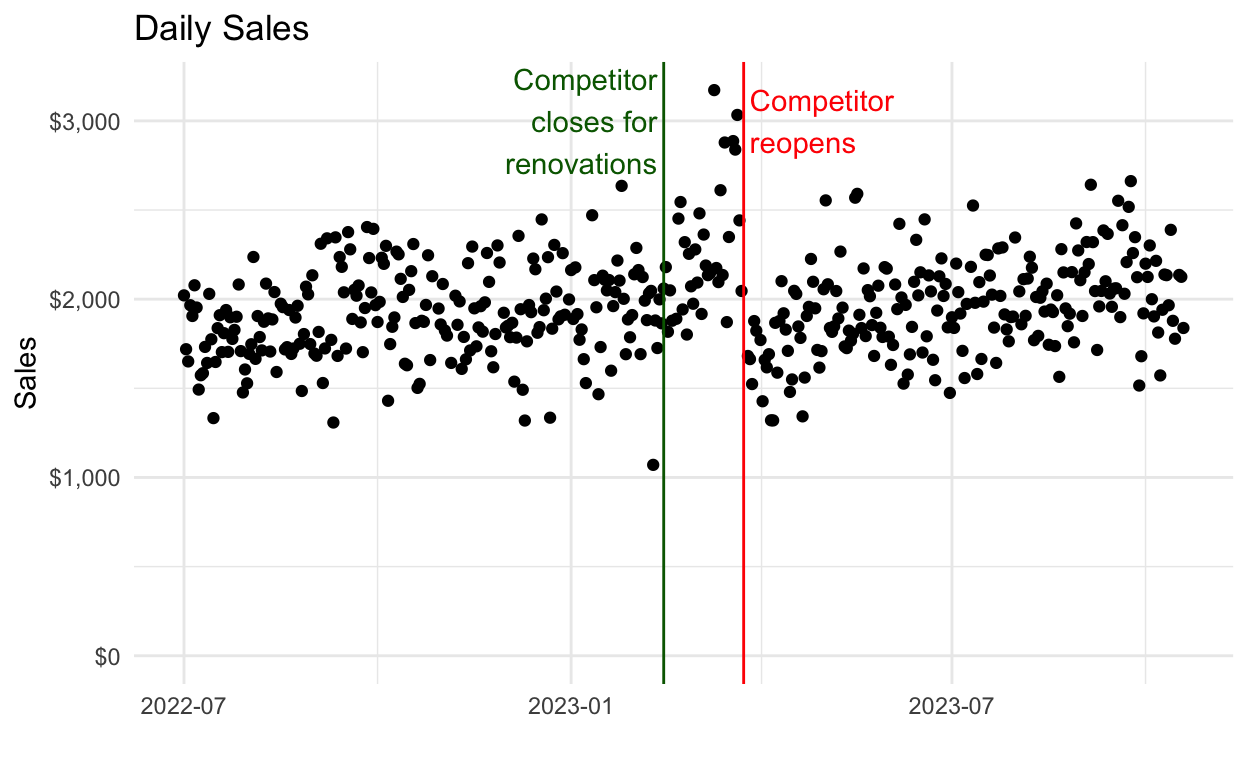
What we’d like to know is:
- the impact on sales during the competitor’s shutdown, and
- the impact on sales of them reopening.
What happened while the competitor was shut down?
In the plots above we saw an increase of sales while the competitor was shut down for renovations - can we estimate how their shutdown increased sales?
This is a bit tricky, and we can’t just compare sales the week (or any other time window) before the shutdown to the week of the shutdown because perhaps there are some seasonal effects (eg people buy more coffee around Valentines day) that need to be accounted for.
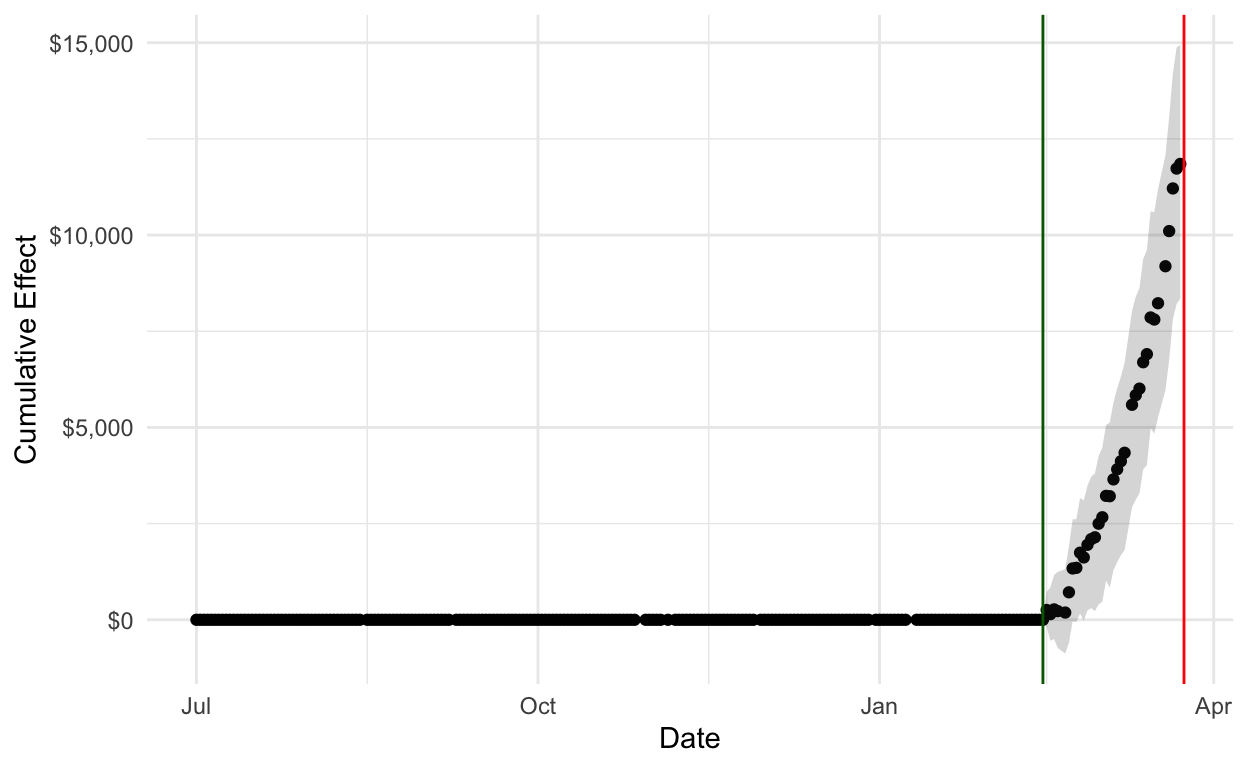
So we use a technique that, in essence, predicts what would have happened based on historical data and then compares it to what actually happened. This is illustrated in the following plot
Up until the competitor shut down, the difference between what we predict and what actually happened is zero. But then we see a change after the competitor shuts down. We show the cumulative effect, i.e. the total amount of sales estimated as a result of their shutting down, and we see that by the end of their shutdown the coffee shop has made an additional 12k or so over what would have been expected if the competitor had stayed open.
The prediction intervals (in gray) show the range of likely values. At the end of the shutdown our best single estimate is that the coffee shop made an additional 12k, but that could actually be anywhere between 8k and 15k. (All good statistical results will provide a range of values, not just a single figure, so that you can assess alternate scenarios)
In summary, during the period the competitor shut down, the coffee shop made more money than would have been expected otherwise.
What happened after they reopened?
We’d also like to know what happened after the competitor reopened. A similar analysis procedure yields the following plot.
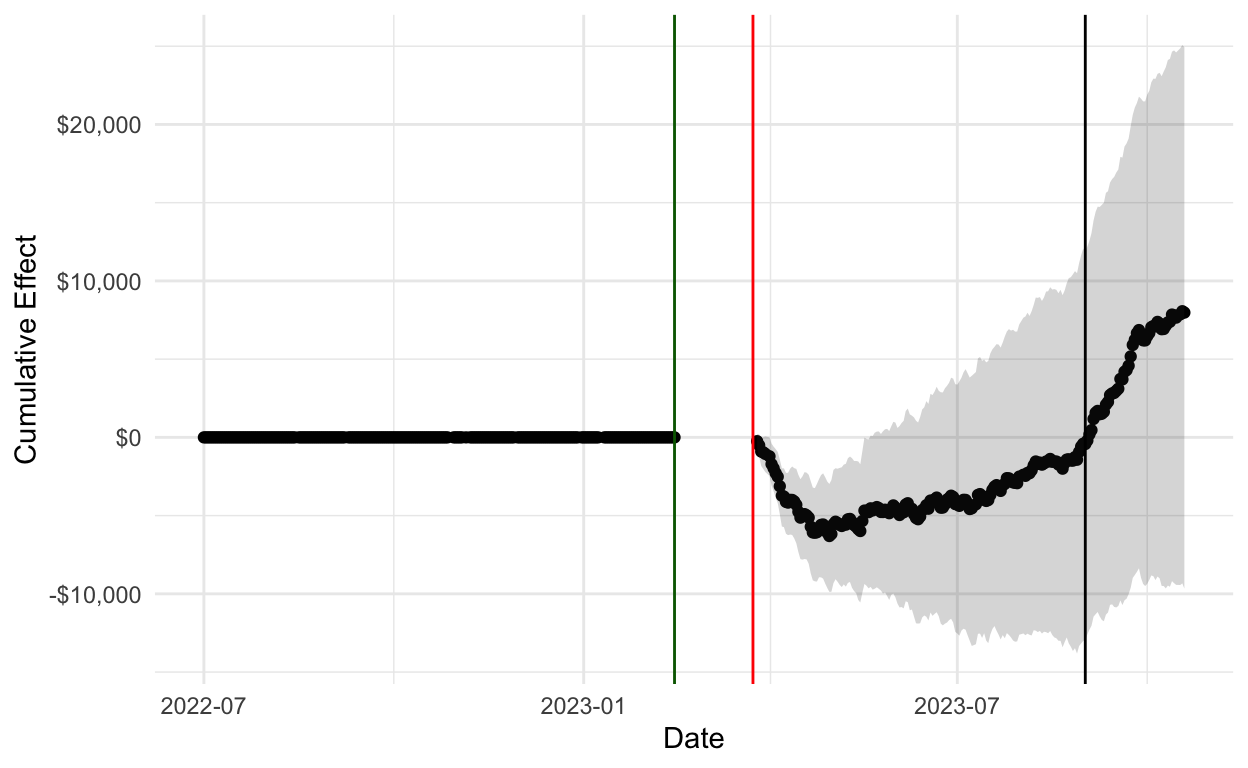
In this time window it looks like there was an overall cumulative increase in sales of approximately 8k by the end of the data period in mid-October.
It is interesting in that there is an initial decline in the cumulative sales. Perhaps customers from both shops decided to give the renovated shop a try.
Then the sales pick up again: the shop’s customers returned, along with newly acquired customers from the competitor.
By Sept 1st the sales are back to what would have been expected, and then they increase due to the newly acquired customers.
Based on this data, and all the assumptions made in the analysis, the competitor closing for renovations increased overall sales.
Outcomes
Analyzing the sales data helped the coffee shop understand the impact of an external event on their sales, allowing them to better estimate future sales and plan accordingly.
Similar techniques can be applied to your business to estimate the impact of sales promotions, advertising campaigns, or even the release of new products on your profits.